
Hardcore Debugging
Solving bugs when nothing else works

Subscribe to Jacob’s Tech Tavern for free to get ludicrously in-depth articles on iOS, Swift, tech, & indie projects in your inbox every week.
Full subscribers unlock Quick Hacks, my advanced tips series, and enjoy my long-form articles 3 weeks before anyone else.

Sometimes, your app crashes.
Sh*t happens.
Usually this is annoying, but straightforward to fix. Maybe you messed up the lifetime of a reference, or perhaps there was some subtle race condition you didn’t consider.
But there’s a class of crash far more insidious.
Crashes which originate deep in the kernel memory management system, where the debugger refuses to narc on the culprit.
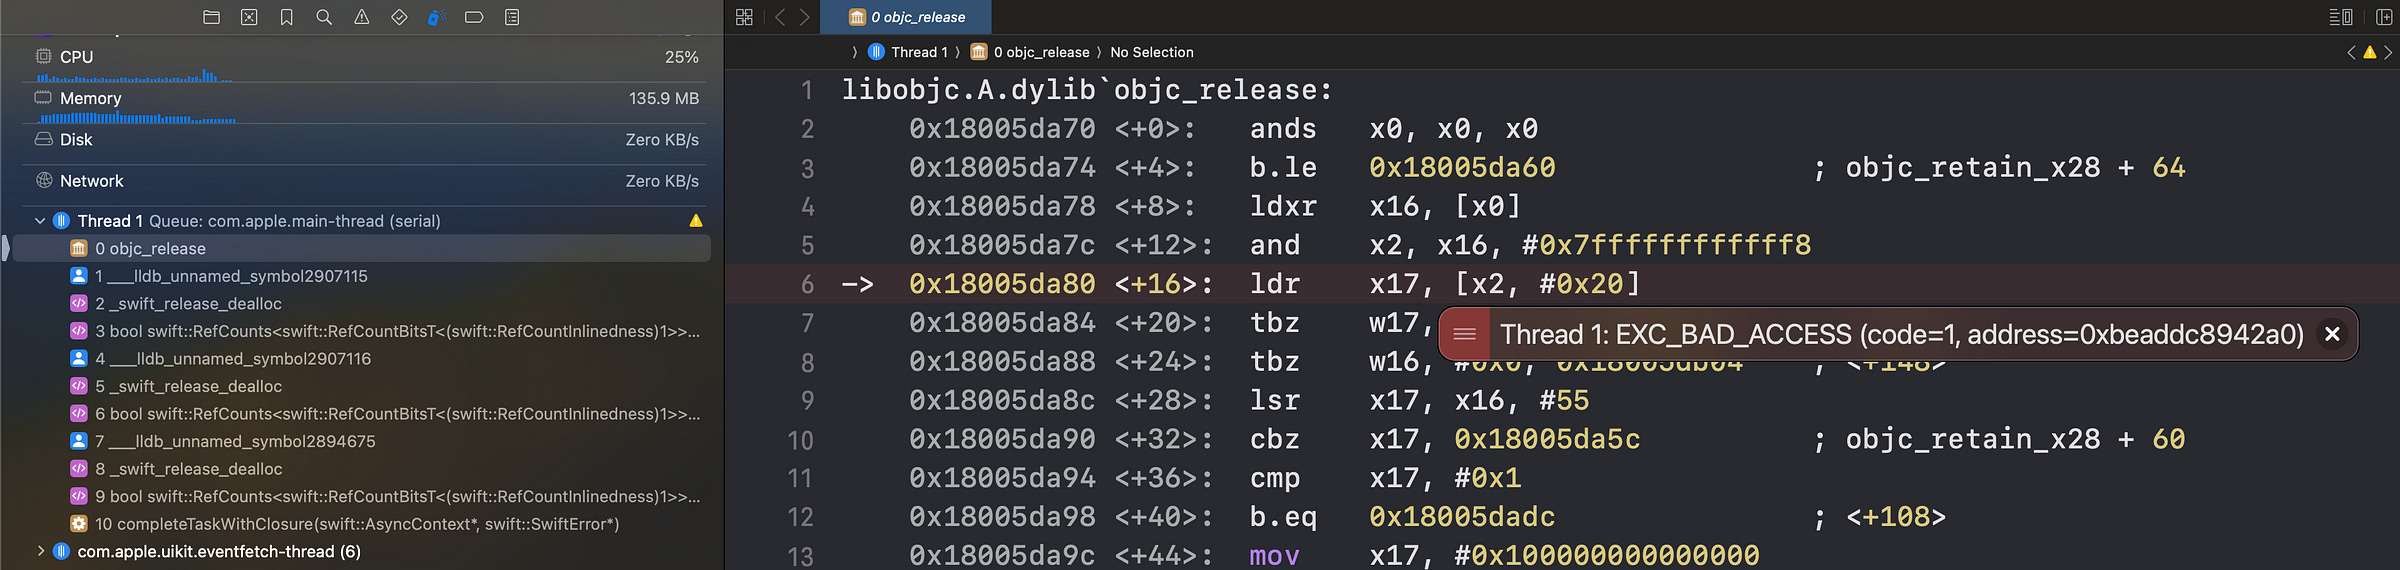
This crash trace yields sparse detail:
It’s the main thread, and something concurrency related.
EXC_BAD_ACCESSsuggests we’ve tried to access deallocated memory.
Lady Luck is smiling on us: mercifully, the crash is 100% reproducible. Unfortunately, it lies on a core user flow and slipped through to production.
We need to pull out our advanced tools. In a pinch, there are a couple of techniques to help pinpoint the source of the crash:
Git Bisect to narrow down through time.
Manually Symbolicating Crash Logs to narrow down across space.
Today’s blog applies these advanced approaches to solve a real-life mystery crash.
Git Bisect
When you work in a fast-paced team shipping dozens of commits every day, bugs might take time to spot. When they are finally noticed, the offending code change might be dozens or even hundreds of commits in the past.
Identifying the guilty commit, where the bug or crash first appears, dramatically simplifies our job. It narrows down the possible error surface to a few hundred lines of code.
git bisect is a tool — really, a wizard — that helps locate the problematic commit using a binary search algorithm.
Running Git Bisect
You can run git bisect from the command line, and it happily displays the commands available:
 % git bisect

usage: git bisect [help|start|bad|good|new|old|terms|skip|next|reset|visualize|view|replay|log|run]
To get it running, just use git bisect start:
status: waiting for both good and bad commitsTo begin the binary search, you need to pass SHA hashes for known good & bad git commits. For example, you might know the latest code on the main branch is bad, but the code from last week’s release 1.2.0 is good. Let’s pass git the hash of this latest known bad commit:
git bisect bad a4e0c6b1f3a9d7e2f5c0a8d3b9e4f1c7b5a2d6e0

status: waiting for good commit(s), bad commit known
We can then pass in the hash for the latest known good commit:
git bisect good f1c4b9a0e7f3d2a5c6e1b8f9d4a3c7b5e0a6f2d88

Bisecting: 592 revisions left to test after this (roughly 9 steps)
[b8d1f5a3e0c6d7f2a4b9e3f0a1d8c5e7b6a2f9d3] DEV-1230 | Social feed added (#1202)
I called this a wizard because git bisect performs the heavy lifting for you. It checks out the branch mid-way between the current most-recent-good & oldest-bad commits.
You can build & run the code, then perform the repro steps to check for the bug or crash. Inform git each time by using plain git bisect good or git bisect bad commands.
% git bisect good

Bisecting: 296 revisions left to test after this (roughly 8 steps)
[1a2d4f65b3e6c9f8d7a0b1c2e3f4a6d5c8b7a0e3] DEV-1020 Add friends feature (#1020)
As git automatically checks out our code, we can intuitively begin to narrow down the possible root cause of the crash.
% git bisect bad

Bisecting: 148 revisions left to test after this (roughly 7 steps)
[a4e0c6b1f3a9d7e2f5c0a8d3b9e4f1c7b5a2d6e0] DEV-1102 Delete account (#1090)
If your code is hosted on Github, you might begin to look at the actual code diffs between the last good and first badcommits by going to github.com/your-org/your-repo/compare.

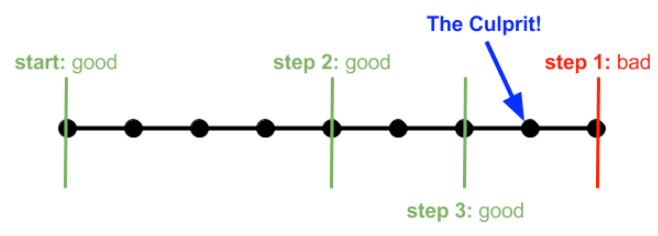
This webpage illustrates every line of code changed between the known good and bad commits. This line count rapidly decreases as you narrow down the search.

Eventually, you get to a final point, the culprit, where git illustrates some of the detail on the offending commit itself:
git bisect bad

f5a7c2d0e8b9f1a6d3c5e4b7a9d2f0b8e3c1f9a4 is the first bad commit
commit f5a7c2d0e8b9f1a6d3c5e4b7a9d2f0b8e3c1f9a4
Author: Jacob Bartlett
Date:   Mon Nov 19 21:12:10 2024 +0000

    DEV-1099 Introduce concurrency in logout (#1076)

 .../Core/Auth/Logout.swift          | 240 ++++++++++++++++-------
 1 file changed, 222 insertions(+), 18 deletions(-)
This technique has taken us far: instead of our entire codebase, we now only have 240 lines of code to investigate in solving our insidious crash.
Words of Wisdom
Outside of the wizard itself, there are a few important things to understand about git bisect when you apply it yourself.
First and foremost, this is an extremely tedious elimination process. Depending on your build system, the initial commit range, and the complexity of your app, this can take hours. It’s fantastic to have in your toolkit, but only worth pulling out when there’s no clear solution.
My colleague once told me, you need to keep your eye on the ball with git bisect. The wizard does so much heavy lifting for you, it’s easy to spend the whole day on autopilot. That’s a mistake — if you log a single wrong good/badcommit, your results are worthless. Clean your builds, test, and then re-test!
Git Bisect Run
If you’re dealing with a build error; or an issue that you can detect via test scrips; there’s an advanced approach called git bisect run. This was used to automatically detect errors in the Linux source code:
git bisect start linux-next/master v2.6.26-rc8
git bisect run make kernel/fork.o
git bisect start defined known bad and good commits; then git bisect run automatically performs the bisection.
It checks out the next mid-point commit to try, then runs the script or command. If this returns exit code 0, it logs good; otherwise, it’s bad. Then it automatically checks out the next commit and narrows down the culprit automatically.
If you’re desperate for more
git bisectcontent, you can look at the source code for git bisect right here on Github.
We’ve bisected in time, and dramatically narrowed down the troublesome code surface area.
Next, we can narrow down the error in space by manually symbolicating crash logs.
Symbolicating Crash Logs
This technique is a subtle one, and frankly you’re unlikely to apply it unless you’re in real trouble — mystery crashes are one of a handful of use cases. I’ve encountered a few scenarios where manual crash log symbolication can help in a tight spot:
The crash is only in release builds, so you can’t reproduce when plugged into the debugger.
Testing internal CI builds, where Xcode crash reports aren’t available.
Crashes on an app extension or app clip that doesn’t have access to your crash reporting SDK.
Something went wrong with your dSYM upload pipeline.
To manually symbolicate crash logs, you need just two things:
The
.ipsfile containing the crash report, stored on the device that crashed.The same build’s corresponding
.appfile or.dSYMfile. You’ll find this in your CI artefacts, or Xcode archives.
Exporting Crash Reports
Let’s get that crash report first.
For iOS 18 users, you can go into:
iOS Settings
Privacy & Security
Analytics & Improvements
Analytics Data
Select the timestamped
.ipslog for the crash you need

Once you export the log to your MacBook, the real fun begins. Any random crash log will look something like this:

Parsing this elaborate crash log file might seem overwhelming at first, but there’s actually just a few simple steps you need to convert this into something useful.
Binary Images
The first thing you need to do is confirm that you’re using the right build. If you’re checking a different build to the report, your results will be useless.
Take your .app or .dSYM file and run this command line tool:
xcrun dwarfdump --uuid Bev.app/Bev
xcrun dwarfdump --uuid Bev.app.dSYM/Contents/Resources/DWARF/Bev
This outputs
abf2219c-a7f3–3463-bea3–6d90dd18cdd9
To confirm this, let’s look at our crash log .ips file. Look for the binary images section, which lists all the compiled binaries available in the executable.
Searching for the dwarfdump UUID will allow you to confirm you’re looking at the right build.
Binary Images:
0x10d4fc010 - 0x017d97dff Bev arm64
<abf2219c-a7f3–3463-bea3–6d90dd18cdd9>
/private/var/containers/Bundle/Application
/E8841A06-578E-4C3A-A477-1A4BA7BA8345/Bev.app/Bev
There’s another extremely important number here: 0x10d4fc010. This is the load address, the memory address in your app’s sandboxed process where a module’s code is loaded into.
Symbolicating The Stack Trace
The load address is the most important number in identifying the crash.
Our .ips report contains a full thread trace containing the state of our app at the crash site, for each thread. But the trace on the main thread contains the code we care about:
Thread 0 Crashed:
0   libobjc.A.dylib                       0x19b72a870 objc_release_x8 + 16
1   Bev                                   0x10f4359d0 0x10d4fc010 + 32741824
2   libswiftCore.dylib                    0x19cdec83c _swift_release_dealloc + 56
3   libswiftCore.dylib                    0x19cded950 bool swift::RefCounts<swift::RefCountBitsT<(swift::RefCountInlinedness)1>>::doDecrementSlow<(swift::PerformDeinit)1>(swift::RefCountBitsT<(swift::RefCountInlinedness)1>, unsigned int) + 160
4   Bev                                   0x10f435a88 0x10d4fc010 + 32742008
5   libswiftCore.dylib                    0x19cdec83c _swift_release_dealloc + 56
6   libswiftCore.dylib                    0x19cded950 bool swift::RefCounts<swift::RefCountBitsT<(swift::RefCountInlinedness)1>>::doDecrementSlow<(swift::PerformDeinit)1>(swift::RefCountBitsT<(swift::RefCountInlinedness)1>, unsigned int) + 160
7   Bev                                   0x10f435a88 0x10d4fc010 + 32742008
8   libswiftCore.dylib                    0x19cdec83c _swift_release_dealloc + 56
9   libswiftCore.dylib                    0x19cded950 bool swift::RefCounts<swift::RefCountBitsT<(swift::RefCountInlinedness)1>>::doDecrementSlow<(swift::PerformDeinit)1>(swift::RefCountBitsT<(swift::RefCountInlinedness)1>, unsigned int) + 160
10  libswift_Concurrency.dylib            0x1a9b4fe68 completeTaskWithClosure(swift::AsyncContext*, swift::SwiftError*) + 48
11  libswift_Concurrency.dylib            0x1a9b4fe39 completeTaskWithClosure(swift::AsyncContext*, swift::SwiftError*) + 1
You’ll notice the load address 0x10d4fc010 alongside stack trace readings in the Bev module. These are alongside actual crash memory addresses for each function call in the stack trace, plus a decimal difference between the load and function memory address.
For example, our code near the root of the crash trace reads:
1 Bev 0x10f4359d0 0x10d4fc010 + 32741824Here, +32741824 is the decimally-notated difference between the hexadecimal load address, 0x10d4fc010, and the hexadecimal memory address of the crashed line of code, 0x10f4359d0.
For the final step, we use atos, a handy command line utility that converts memory addresses into human-readable symbols. It should be packaged into your MacBook out-of-the-box.
atosis a smushed-together shortening of address-to-symbol.
The API here is kinda simple, when you have all the pieces together in one folder.
atos -o Bev.app/Bev -arch arm64 -l 0x10d4fc010 0x19b72a870 0x10f4359d0 0x19cdec83c 0x19cded950 0x10f435a88
You can ostensibly use either the app or the dSYM, but the app executable might be obfuscated, making the dSYM approach more reliable:
atos -arch arm64 -o Bev.app.dSYM/Contents/Resources/DWARF/Bev -l 0x10d4fc010 0x19b72a870 0x10f4359d0 0x19cdec83c 0x19cded950 0x10f435a88
The arguments are pretty straightforward:
-arch arm64denotes the chip architecture of the compiled app.-o Bev.app.dSYMselects the compiled object code we’re going to read.-l 0x10d4fc010enters the load address of the executable.Finally, we list the process memory addresses of the trace.
Here’s the result, logged straight to your terminal:
#0 0x000000019b72a870 in swift_retain ()
#1 0x000000010f4359d0 in NavigationBar.notificationListener.getter ()
#2 0x000000019cdec83c in closure #1 in NavigationBar.deinit at /Users/jacob/TechTest/UI/NavigationBar.swift:69
#3 0x000000019cded950 in partial apply for closure #1 in NavigationBar.deinit ()
#4 0x000000010f435a88 in thunk for @escaping @callee_guaranteed @Sendable @async () -> () ()
Now we have a lot of information about the crash.
We knew from the start we were crashing on the main thread, and EXC_BAD_ACCESS suggested we were trying to access deallocated memory. We also suspected the crash was around use of concurrency.
In addition to this, now we know:
The invalid memory we are accessing is
NavigationBar.notificationListenerThis property is accessed in the
NavigationBardeinitializer
This also jives with the known bug reproduction steps. We’re seeing the light at the end of the tunnel (or, more accurately, the tedious and upsetting day spent debugging).
If atos fails, dive into the dSYM
In this case, atos tells us exactly where to look. But sometimes atos might fail unexpectedly. If you want to get reallygreasy, you can dive straight into the dSYM itself. Just open the symbol mappings in a text editor:
Bev.app.dSYM/Contents/Resources/Relocations/aarch64/Bev.yml
This yml file contains data about symbols — functions, variables, or initialisers — along with their corresponding memory address offsets.
You might not find an exact match for the memory address, but you can be clever with locality — memory addresses of all the symbols in a class cluster together.

If we search for 0x10f4359d0, the root of the crash trace that matches the crash in our Bev module, we can’t spot an exact match.

We can start deleting a few bytes from the little end to search for a bigger range of memory addresses. Now, when looking for 0x10f4359, we get a whole cluster of symbol offsets pointing towards our NavigationBar.

This last-resort technique saved my bacon recently: bisecting narrowed us down to an enormous 10,000-line commit, and atos refused to cooperate with our crash trace.
The Culprit
We narrowed our bug down to a reusable UI component, NavigationBar. Specifically, its deinitializer.
Like many nav bars, it shows a notification count in the corner.
@MainActor
final class NavigationBar: NSObject {
    lazy var notificationListener = SequenceListener<Int>()

    // ... set up listeners

    deinit {
        Task { @MainActor in
            notificationListener.cancel()
        }
    }
}
SequenceListener is a simple wrapper around a Combine publisher that converts them into an AsyncStream via their values property.
Bookmark my recent work, Migrating Combine to AsyncAlgorithms, for later!
When we breakpoint the deinitializer in the listener, we end up with a stack trace virtually identical to our EXC_BAD_ACCESS we had at the start.
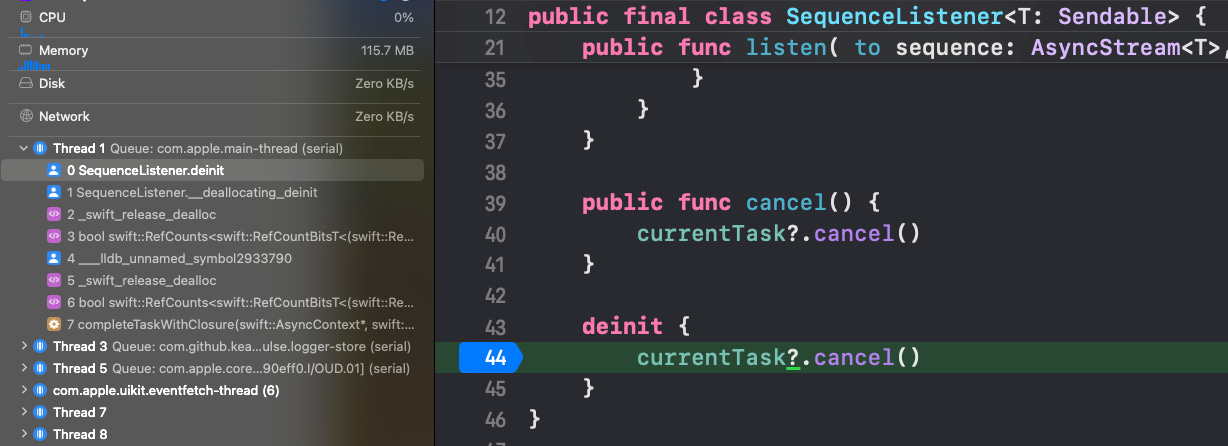
Now that we know the offending lines of code, the issue is simple.
So why was it Crashing?
The NavigationBar deinitializer is called when its parent screen deallocates. Immediately after deinit finishes executing, the nav bar properties are deallocated, and their memory invalidated.
We tried to clean up our listener by calling cancel(). Since our nav bar is annotated @MainActor, we can only access the properties from a Task on the main actor*.
This Task is therefore marked @MainActor, but it’s still dispatched to the main actor’s executor asynchronously, where it is queued up for execution on the UI thread. The memory invalidation on our property happens before we call cancel(), leading to our bad access crash.
*
deinitshould be locked to the main actor, however the compiler errors don’t seem to respect this. Maybe things will be better in Swift 6 🤷♂️To learn more about Task threading gotchas, check out why is my Task running on the main thread?
Now that we understand the problem, the solution is trivial. We can either take our NavigationBar off the Main Actor to allow us to clean up our listener normally:
final class NavigationBar: NSObject {
    lazy var notificationListener = SequenceListener<Int>()

    // ... set up listeners

    deinit {
        notificationListener.cancel()
    }
}
Or, even more simply, we didn’t need this cleanup code at all — the listener’s deinitializer already cancels it!
Conclusion
Sometimes, you get a mysterious bug you simply can’t solve with the debugger. Other times, you might simply not have access to crash reporting.
Advanced techniques like git bisect and manual crash symbolication with atos seldom needed, but when nothing else works, can be an absolute lifesaver.
I’ve been reading up on my narrative techniques; so I hope you liked the foreshadowing I lay out in the opening paragraph:
Maybe you messed up the lifetime of a reference, or perhaps there was some subtle race condition you didn’t consider.
This is known in the literary industry as Chekhov’s Gun.
To read more content on the dangers of deallocated memory, you can read Jailbreak your Enemies with a Link: Remote Execution on iOS.
If you’d like to learn more about how crashes are thrown from the kernel memory management system, check out my piece What Is A Crash?

Interesting side note, you can actually have Xcode symbolicate a crash log for you instead of fetching adresses manually and feeding it to atos https://developer.apple.com/documentation/xcode/adding-identifiable-symbol-names-to-a-crash-report#Symbolicate-the-crash-report-in-Xcode you will still need to have the app or dsym though ^^