But, like all well-designed magic systems, it comes with a cost.
What, you thought that beautiful declarative syntax and automatic data bindings come free? Think again.
Swift’s pesky memory safety mechanisms put it at a performance disadvantage compared to unsafe languages like C and C++. In the same way, SwiftUI’s beautiful reactive data-flow gobbles CPU cycles like an Ozempic patient at the hot-dog eating contest.
To achieve the maximum 120Hz refresh rate, the main thread has to execute all layout computation and rendering in 8.3ms to avoid a frame drop: the dreaded hitch. With system overhead, you’re lucky to get 5ms for this work.
SwiftUI can run into very painful performance problems when dealing with infinite scrolling feeds. Today, we will investigate these performance problems, understand why they happen, and explore techniques to mitigate them, making your SwiftUI performance buttery smooth 🧈.
Subscribe to Jacob’s Tech Tavern for free to get ludicrously in-depth articles on iOS, Swift, tech, & indie projects in your inbox every week.
We’re going to focus on scroll views, the most popular punching-bag of SwiftUI detractors. Let’s try out some approaches to get an infinitely-scrolling view that runs at a cool 120fps.
We have a simple SwiftUI feed, with many identical cells containing a couple of photos (courtesy of Lorem Picsum), text, a spinner animation, and a cool gradient effect underneath the user’s name and profile pic.
I’m a scientist at heart. To ensure a fair test, I am running all of these profiles on my iPhone 15 Pro, running iOS 18.3.2.
Since the system decides when to run at 120fps vs the regular 60, I couldn’t consistently get CADisplayLink to call back at 120Hz. Therefore, we are really going to do the 60fps challenge.
To apologise for this deception, I’ll make it harder for myself and perform all the testing on Low Power Mode, where the system is throttled. At my startup, this is one of our favourite techniques to test our app for high performance: if your screen scrolls smoothly on Low Power Mode, you’re golden.
VStack
There are several ways we might structure the scrolling feed. Our first port of call might be a VStack.
If this isn’t your first rodeo, you might predict what happens when we profile it with the Animation Hitches instrument.
The screen immediately froze up when I loaded into the app. This huge initial hang is because VStacks load and render the entire view hierarchy when they display. This meant all 1,000 cells were being loaded and laid out simultaneously.
Touching the screen did nothing. All interaction was blocked.
Once it had finished loading, I could now interact with the scroll view, but experienced frame drops galore.
If your performance trace looks like this, YNGMI
As you can see through the VSync trace, while some frames rendered in the expected 16.67ms (60fps), many took far longer, which manifested as many dropped frames per second.
Eagerly loading 1,000 views all at once also created a massive memory spike accompanying the hang, which never went away since the views were all held in memory.
Clearly, VStack isn’t the way to go with scrolling feeds.
LazyVStack
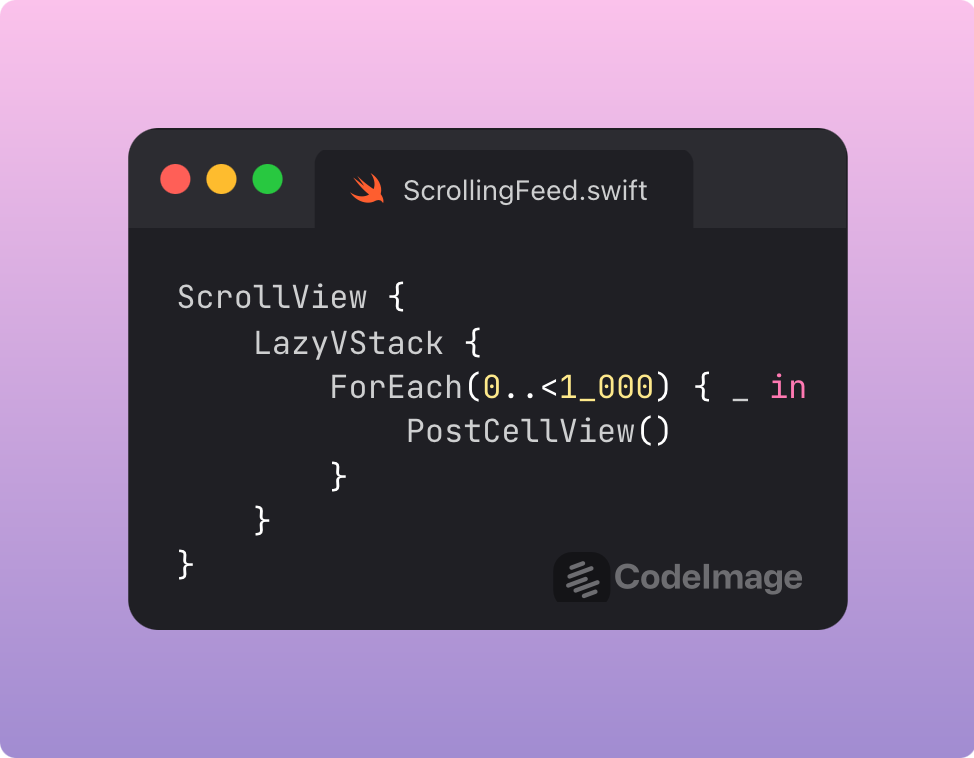
Let’s upgrade to the next approach—the one recommended by Apple for scrollable feeds—the LazyVStack.
Lazy stacks load and render their subviews on-demand, as they scroll close to the viewport (the visible on-screen portion of your layout).
Because these sizing and layout computations are performed on-demand, we are trading off some accuracy to get this performance. LazyVStack dynamically estimates geometry based on the number of views.
What does this mean practically? Let’s imagine your views are all dynamically sized, or your layout contains cells with varying heights. If you programmatically scroll to a specific cell way off-screen, SwiftUI suddenly has to run all this layout computation, causing a big performance hit*.
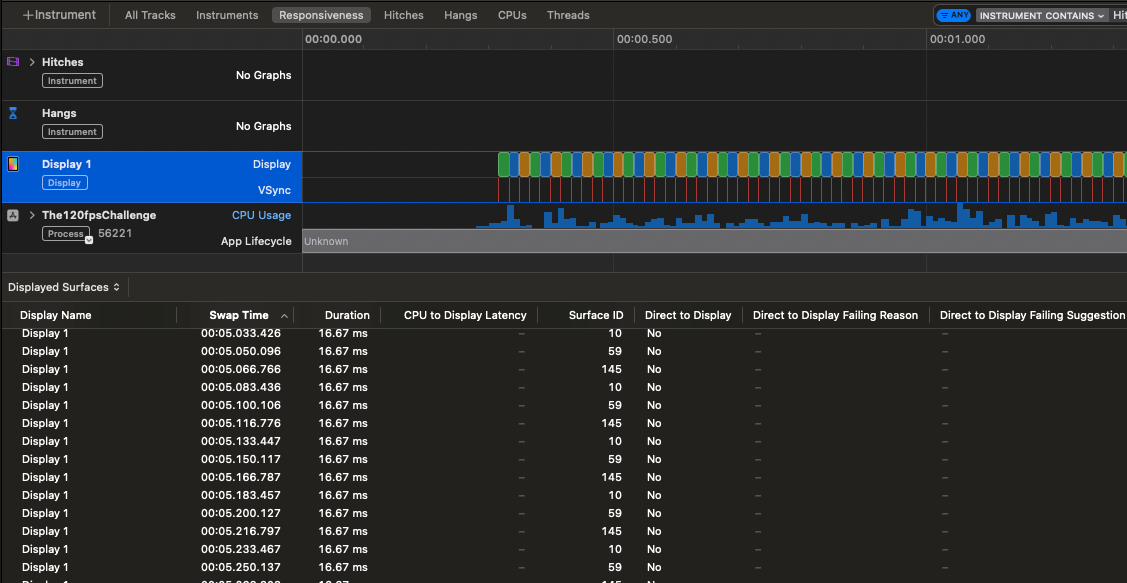
The Instruments trace on loading and scrolling is much more healthy. You can see in the trace that VSync comfortably pushes each frame at the required 16.67ms interval for 60fps, even on Low Power Mode.
Scrolling down through hundreds of items, we get a few very minor frame drops but no hangs. From the point of View of SwiftUI, only a few items are on-screen at once, so it can all be comfortably computed and rendered in the milliseconds between each frame.
This is a great base case, but now let’s take a look at dynamically-sized cells:
Now we see a visible degradation in performance, with several dropped frames.
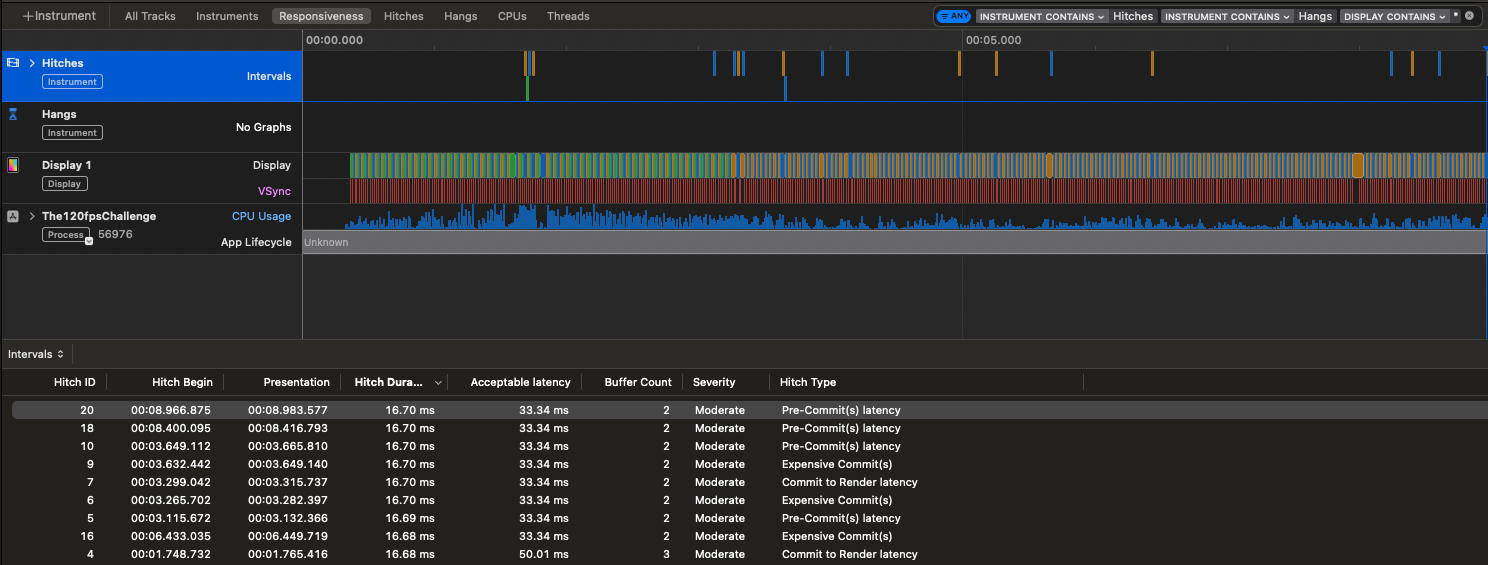
In case you don’t have perfect vision, or the Substack video compression is getting you down, here’s the trace showing these dropped frames and micro-hangs. Overall, though, it wasn’t terrible considering the unfair example I used (with random cell heights).
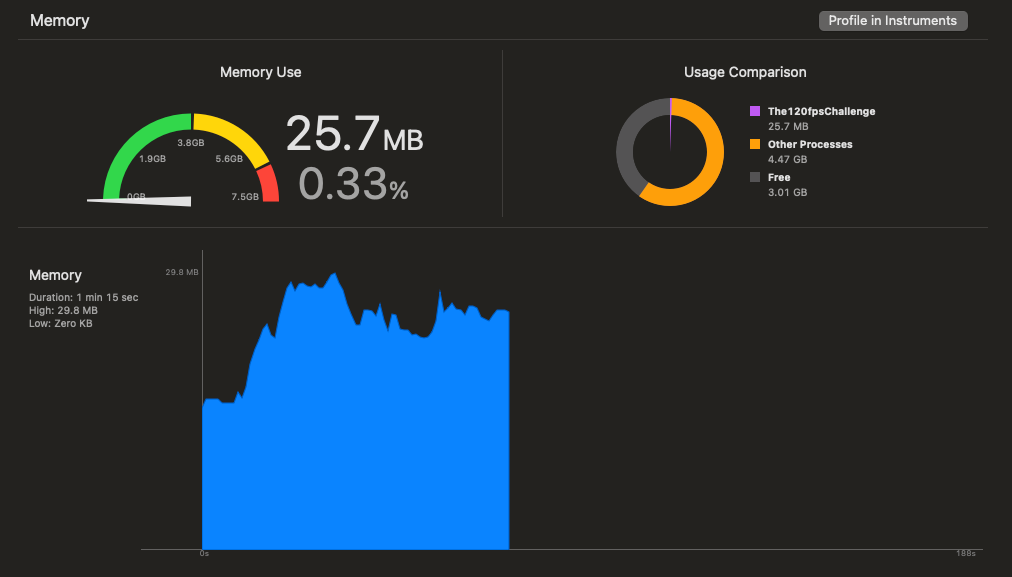
Memory usage on LazyVStack is pretty consistent. It jumped a little when I was scrolled very fast, but didn’t spike dramatically, evicting view data from memory as they scrolled past the viewport.
I was, however, able to break LazyVStack when using dynamic-sized cells.
When I dragged the scroll indicator to scroll up and down frantically, the LazyVStack dynamic height estimation crapped out. It started glitching, causing our scrolling to jump wildly on its own, and spiked memory usage.
This profile massively exceeded my expectations.
I’ve read before that LazyVStack is only lazy one-way; so cells stick around in memory indefinitely after appearing, causing scrolling to gradually get slower and slower.
To sate my curiosity, I installed the iOS 16.0 SDK and re-ran my profiling. As expected, I observed this growth in memory usage (and degradation in performance) the further we scrolled.
LazyVStack has evidently been upgraded under the hood since iOS 16, to become lazy in both directions.
Subscribe for free to continue reading
Enter your email and get every post from Jacob’s Tech Tavern.